Inventory Turnover Analysis Report
Inventory turnover is a ratio reflecting how many times a business has sold and replenished its inventory within a defined period. Measuring this metric enables companies to make more informed purchasing and stocking decisions.
Importance of Turnover Analysis
- Turning inventory into cash: Inventory holds critical capital that could otherwise generate profit. Analyzing turnover by product helps identify ways to accelerate inventory movement.
- Identifying demand uncertainty: Shifts in demand directly impact profitability. A sharp decline ties up cash in unneeded stock; a sharp rise without sufficient inventory causes missed revenue. Managing demand uncertainty is essential for maximizing utilization and profit.
- Assessing holding risk: The turnover ratio reveals whether funds are allocated to the right products. Monitoring this ratio is key to tracking and mitigating inventory risk.
- Preventing overstocking: Excess stock immobilizes capital and reduces business agility. Avoiding overstock situations is vital to maintaining financial health.
Advantages of Turnover Analysis
- Price stability: Moving inventory quickly supports consistent pricing in the market.
- Fresh product availability: Efficient selling keeps new products flowing in and helps rotate items across display areas for returning customers.
- Improved buying power: Consistently high-volume sales allow larger orders at better supplier rates, reducing per-unit inventory costs.
- Reduced waste: High turnover limits exposure to losses from perishable or date-sensitive items.
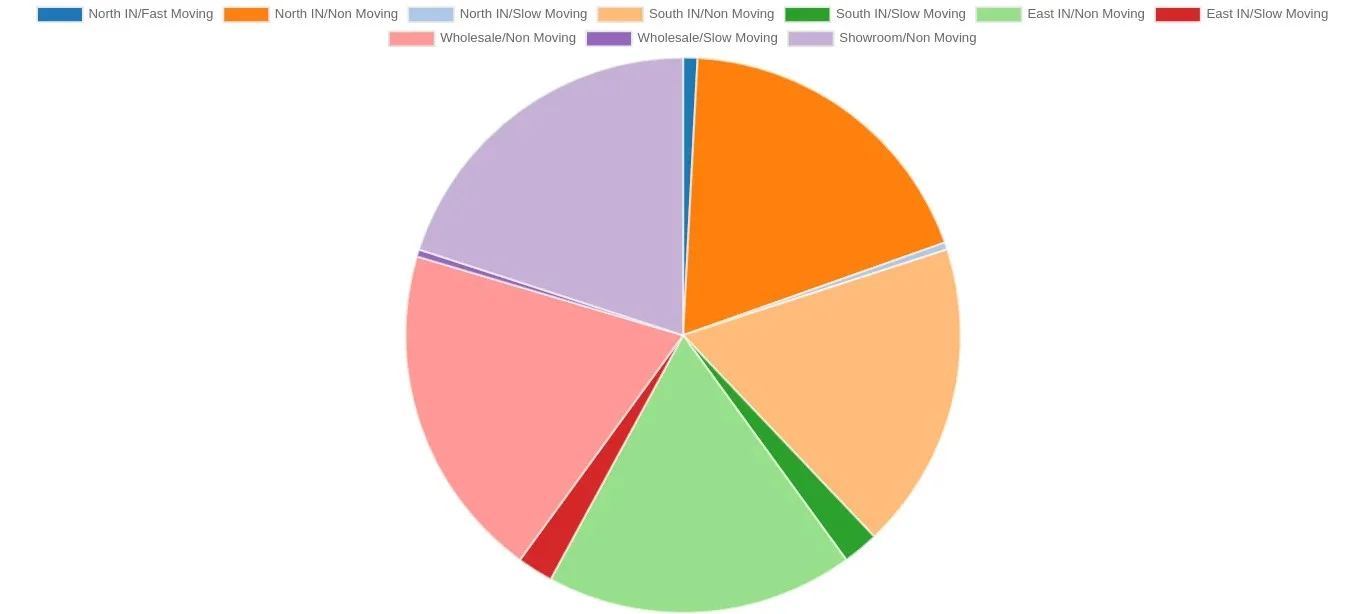
Inventory FSN Analysis Report
FSN categorizes inventory into fast-moving, slow-moving, and non-moving items, examining quantity, consumption rate, and issue frequency. It supports better stock arrangement, distribution, and handling with the primary goal of minimizing inventory obsolescence. In rapidly evolving technology environments, this classification requires more frequent updates.
FSN analysis is grounded in the stock turnover ratio, the ratio of a material's annual consumption to its average inventory level. Items fall into three categories:
Item Classifications
- Fast-moving (F): Items with a stock turnover ratio above 3.
- Slow-moving (S): Items with a stock turnover ratio between 1 and 3.
- Non-moving (N): Items with a stock turnover ratio below 1.
Advantages of FSN Analysis
- Identifies dead stock and fast-moving inventory clearly.
- Highlights which items remain active within your inventory.
- Supports smarter procurement decisions aligned with actual demand.
- Flags non-moving items consuming valuable warehouse space.
- Supports separate reporting by warehouse.
- Filterable by company, category, warehouse, and product.
- Reports are exportable in Excel format.
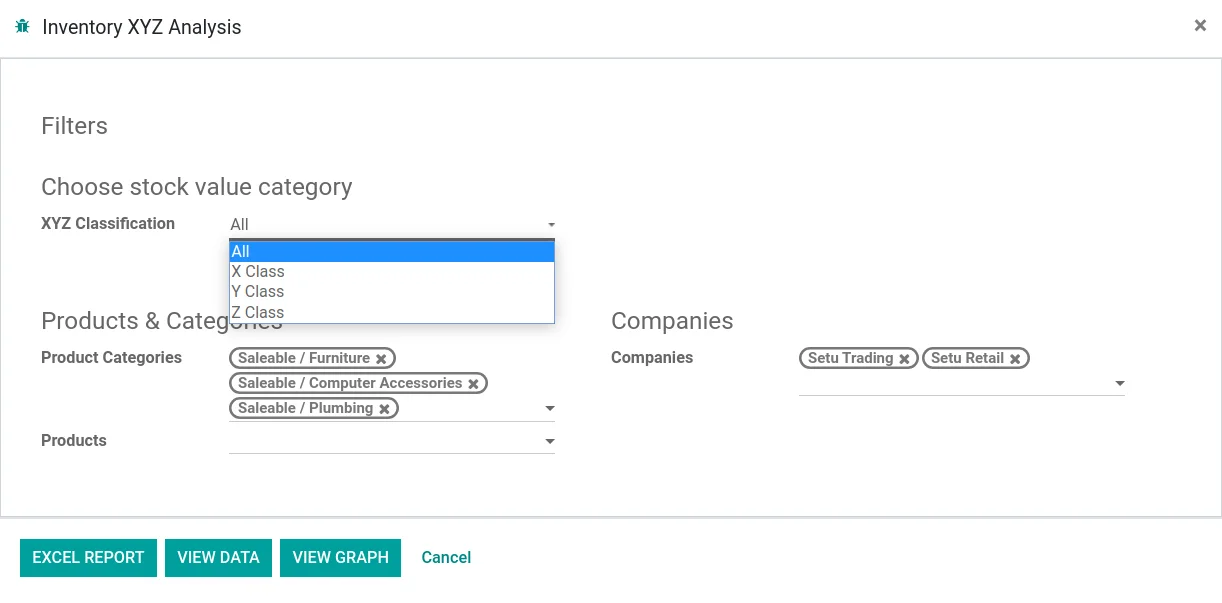
Inventory XYZ Analysis Report
XYZ Analysis evaluates current inventory based on total value. It classifies stock into three tiers reflecting each item's financial contribution to the overall inventory. This analysis applies only to stock on hand at the current date and is not available for historical periods.
Value-Based Classification
- X Class: Top 70% of total inventory value, highest investment items.
- Y Class: Next 20% of total inventory value, moderate investment items.
- Z Class: Remaining 10% of total inventory value, lowest investment items.
Advantages of XYZ Analysis
- Provides a clear picture of where inventory investment is concentrated.
- Helps determine which items require dedicated sales strategies.
- Guides the level of monitoring and control appropriate for each item.
- High-value items receive close oversight and strict controls.
- Mid-range items are managed with standard procedures and periodic reviews.
- Low-value items may require minimal control and can be issued as forward stock.
- Company-level reporting with filters for categories and products.
- Reports are exportable in Excel format.
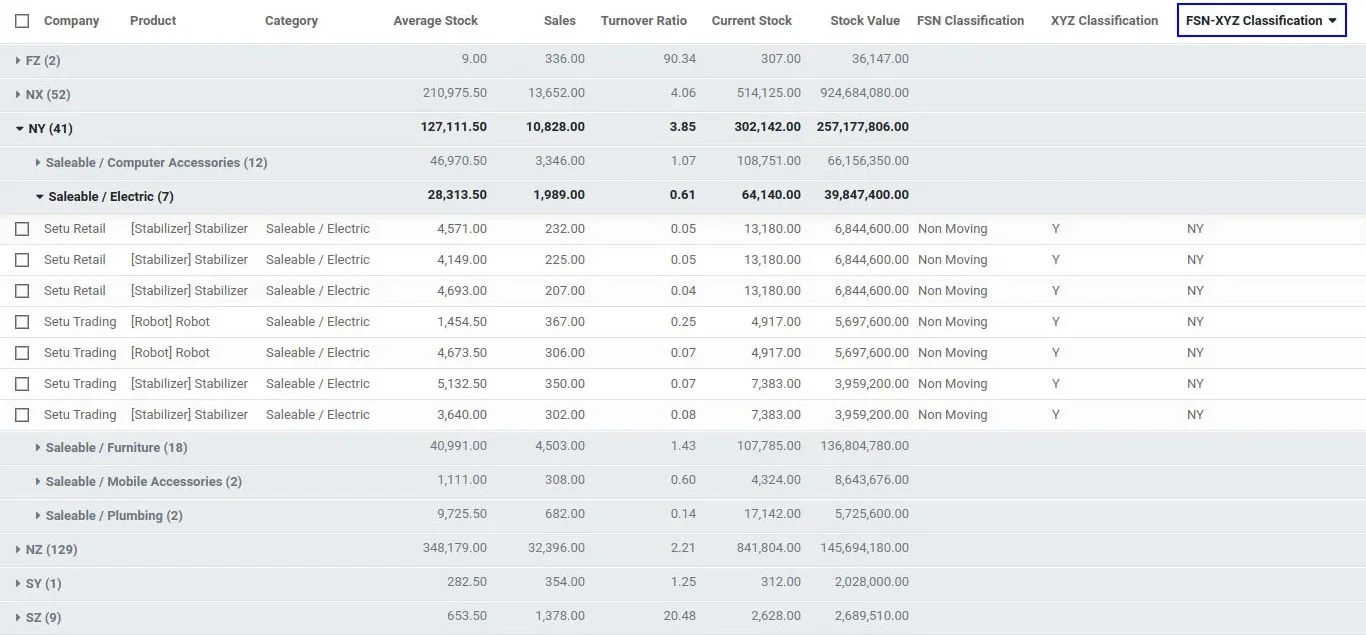
Inventory FSN-XYZ Combined Analysis Report
Not all inventory items are consumed with equal regularity. Some materials are needed continuously, others occasionally, and some have not been requested in years. Combining XYZ with FSN analysis enables more targeted strategies, guiding specific decisions around stock disposal and improving the company's capital position.
For example, a non-moving item classified as X (high value) signals an immediate disposal opportunity. Selling off such stock frees warehouse space and releases tied-up capital.
Advantages of FSN-XYZ Combined Analysis
- Enables more precise and targeted inventory management strategies.
- Quickly surfaces dead stock and frozen investment.
- Clarifies appropriate service levels for items with unpredictable demand.
- Reduces the risk of stock becoming obsolete.
- Improves the accuracy of demand forecasting.
- Minimizes stockouts, which in turn improves production efficiency and customer satisfaction.
- Company-level separate reporting with filters for categories and products.
- Reports are exportable in Excel format.
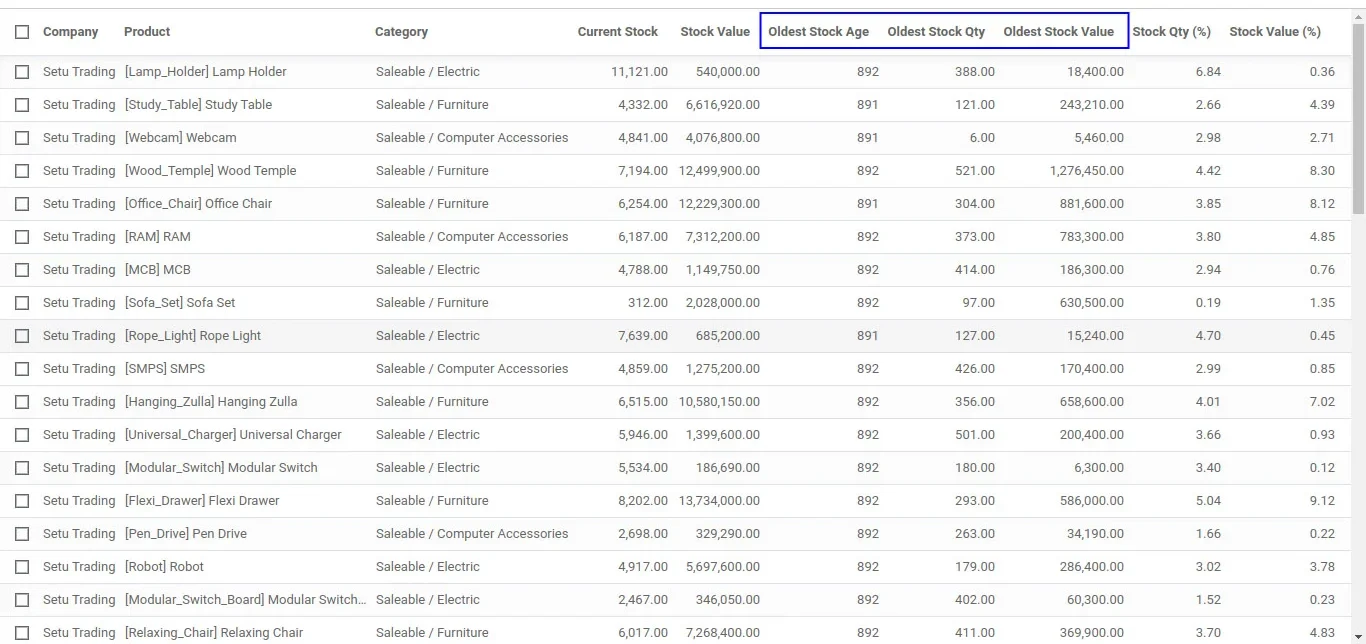
Inventory Age & Age Breakdown Analysis Report
Inventory ageing reports indicate how long each item has remained in stock based on its receipt date. This insight enables smarter decisions around purchasing volumes and timing. Identifying stock levels and age is essential for refining purchasing strategies and developing targeted sales plans.
An inventory ageing report groups on-hand items by the duration they have been held, helping identify slow-moving stock and the additional costs incurred to store and preserve these products until sold.
Advantages of Age & Age Breakdown Analysis
- Directs attention to the slowest-moving items in your inventory.
- Improves decision-making around purchase timing and order quantities.
- Helps reduce storage costs required to maintain product quality over time.
- Enables benchmarking of inventory dwell time against industry standards.
- Facilitates comparison of inventory control performance across divisions or competitors.
- Stock age data is available in graphical and list view formats for flexible analysis.
- Company-level separate reporting with filters for categories and products.
- Reports are exportable in Excel format.
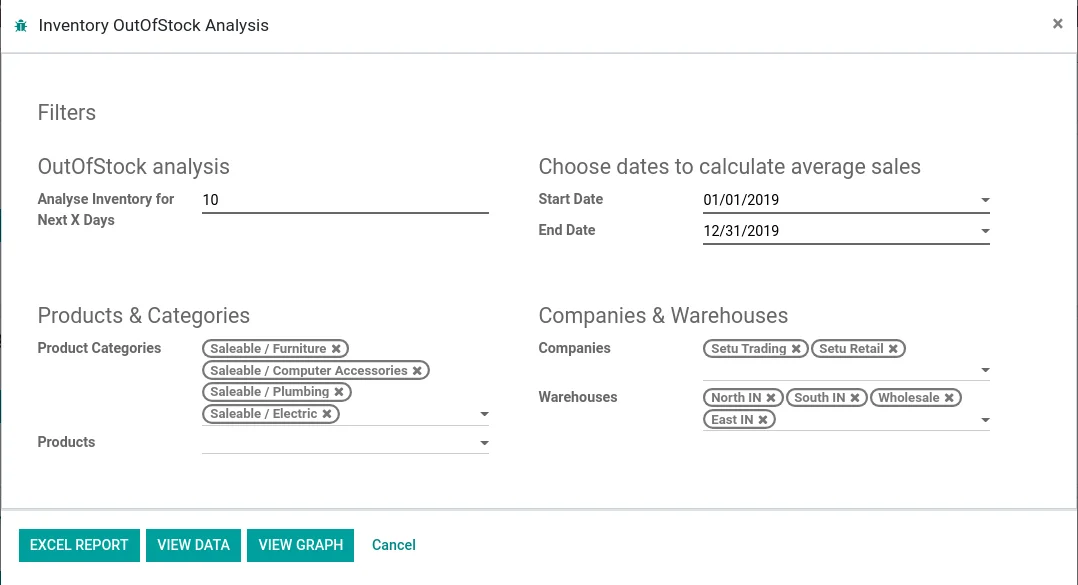
Inventory Out Of Stock Analysis Report
Stockouts rank among the most damaging events for retailers, not just in lost revenue, but in reduced customer satisfaction and loyalty. This report helps you analyze how many products are at risk of running out, identify required restock quantities, and apply FSN classification to determine whether replenishing each item is truly worthwhile.
Advantages of Out Of Stock Analysis
- Measures how many days of inventory coverage remain for each product.
- Strengthens and streamlines the reordering process.
- Identifies future demand periods where stock will be insufficient.
- Calculates the cash flow needed to replenish out-of-stock items.
- Uses FSN classification to determine which products are worth restocking.
- Supports more accurate and forward-looking inventory forecasting.
- Separate reporting by warehouse with filters for companies, categories, and products.
- Reports are exportable in Excel format.
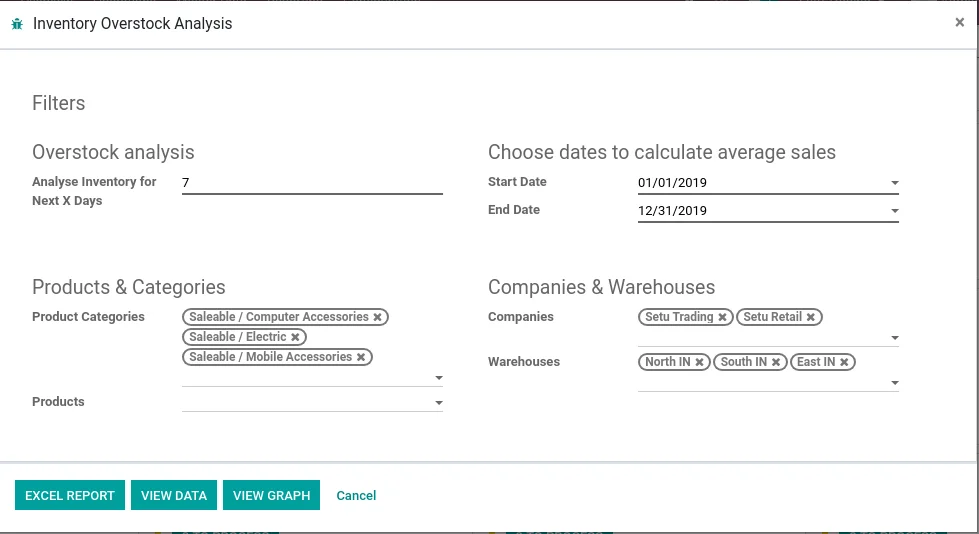
Inventory Overstock Analysis Report
Excess inventory is a serious burden. It locks up capital and can inflict significant losses, particularly when inactive items accumulate unchecked. This report helps you avoid over-ordering by surfacing surplus stock early, while also applying XYZ and FSN classifications to your existing inventory for deeper strategic insight.
Advantages of Inventory Overstock Analysis
- Combined FSN-XYZ overstock reporting clearly identifies dead investment.
- Evaluates the accuracy of past stock forecasting decisions.
- Provides product-level inventory value and its share of total inventory.
- Flags items requiring close monitoring and tighter controls.
- Supports improved reorder planning and procurement efficiency.
- Separate reporting by warehouse with filters for companies, categories, and products.
- Reports are exportable in Excel format.
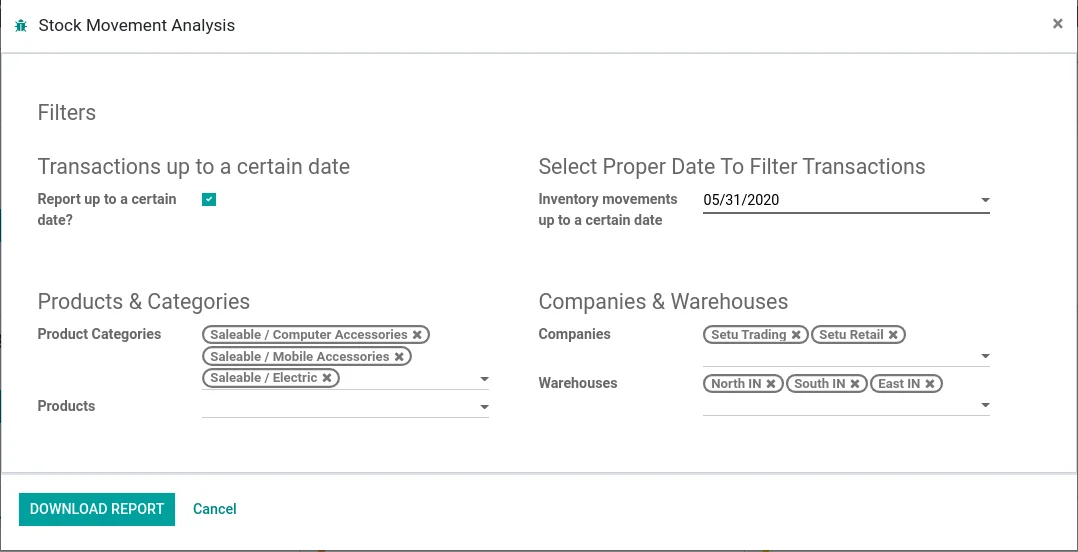
Inventory Movement Analysis Report
Tracking inventory movements across a large product catalogue or high-frequency transaction environment can be complex. This report provides a comprehensive view of stock activity for any defined period or up to a specific date, across all products and warehouses. Users can filter by product category, product, company, and warehouse.
Report Highlights
- Opening Stock: Displays the calculated beginning balance for each product at the start of the selected period.
- Purchase & Purchase Returns: Total quantity purchased and returned within the defined period.
- Sales & Sales Returns: Total quantity sold and returned within the defined period.
- Internal Transactions (In/Out): Tracks all internal stock movements in and out.
- Inventory Adjustments (In/Out): Captures stock adjustment entries both incoming and outgoing.
- Transit Transactions (In/Out): Tracks goods in transit, inbound and outbound.
- Production Tracking (In/Out): Records production output quantities and raw material consumption.
- Closing Stock: Displays the calculated ending balance for the defined period.
Key Features
- Generate reports between specific dates or up to any chosen date.
- All transaction types are captured with accurate opening and closing balances.
- Always reflects a true calculated opening and closing inventory position.
- All IN and OUT movements are separately visible within the report.
- Warehouse-level separate reporting.
- Filterable by company, category, warehouse, and product.
- Reports are downloadable in a well-structured Excel format.